Application Insights with Azure


An important part of any web site or web application is monitoring the health and usage of the application. Typically, web developers monitor the usage of the web site with a third-party analytics tool like Google Analytics, Webtrends, etc. Monitoring the health of an application can be a little more difficult. To monitor the health, we typically are making sure the site is up and running, looking for errors or exceptions that are happening on the site, and looking into error logs when problems occur.
Microsoft Azure provides a new suite of tools called Application Insights that allow web site owners to monitor both the health and usage of the site:
-
Usage analytics provide the details of the site visits, such as what pages are being hit.
-
Web Tests allow you to monitor website availability and uptime by hitting specific pages to make sure each returns the expected result.
-
The Status Monitor can be installed on your web server to track performance issues.
-
The Application Insights SDK can be installed with your project code and deployed to the web server to provide rich performance data as well.
In this article, we will focus on gathering web site usage information with Application Insights Usage Analytics.
Configuring Your Web Site to Use Analytics
Usage analytics are available at no cost for any web site pricing tier (e.g. Free, Shared, Basic, and Standard). To use analytics you will need to add a small section of JavaScript to your web page code. If you have used other analytics tools like Google Analytics or Webtrends, the process for adding Application Insights analytics is very similar.
It is important to note that the Application Insights features are only found in the new preview management portal, which can be found at https://portal.azure.com.
First, log in to the new Azure management portal at https://portal.azure.com.
On the left hand side, select “Browse” from the main menu, and filter by Application Insights. This process is depicted in Figure 1.
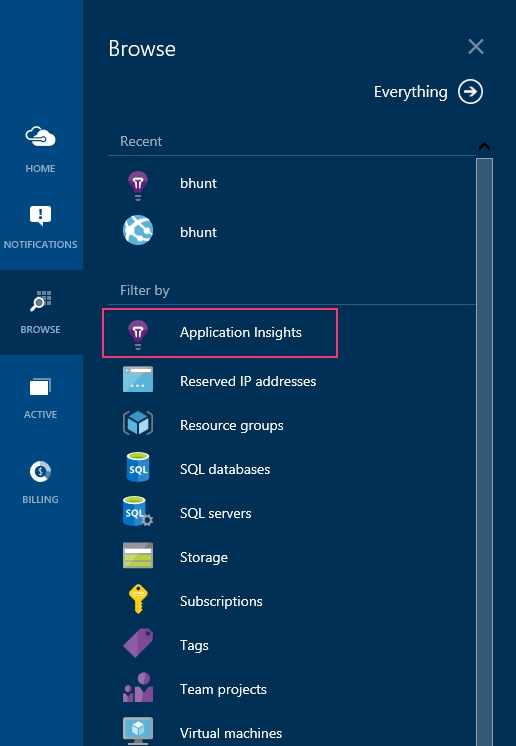
Figure 1: Selecting Application Insights filter
After selecting Application Insights, a new “blade” will appear to the right showing a list of all your web sites. Note that “blade” is a new Microsoft term to describe the user interface sections in the new Azure management portal. Figure 2 shows the list of web sites—click on the name of the site on which you want to install analytics code.
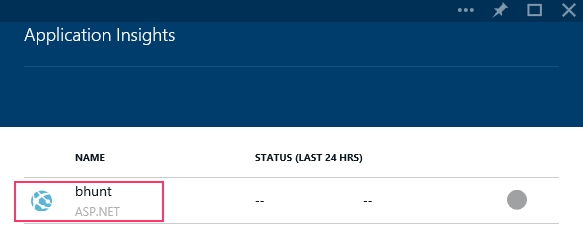
Figure 2: Selecting the web site on which to install tracking
After you select the web site, two new blades will appear to the right. The first is the Application Insights blade for the selected web site, and—if the selected site does not yet use any Application Insights features—a second “Quick start” blade will appear to the right of the Application Insights blade. See Figure 3.
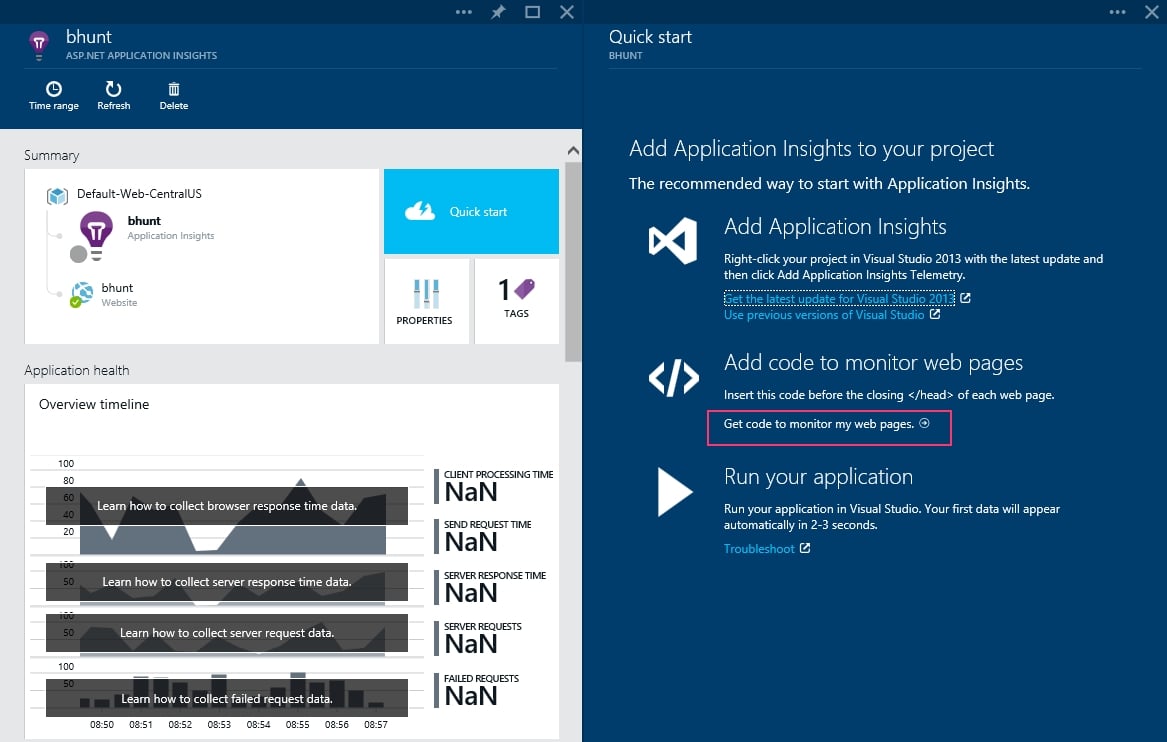
Figure 3: Application Insights and Quick Start Blades
As you can see in Figure 3, the Quick start blade has various ways to get started with Application Insights. We are interested in monitoring web pages, so click on the link labelled “Get code to monitor my web pages.” Doing so will bring up a new blade showing the end-user usage analytics code, as shown in Figure 4.
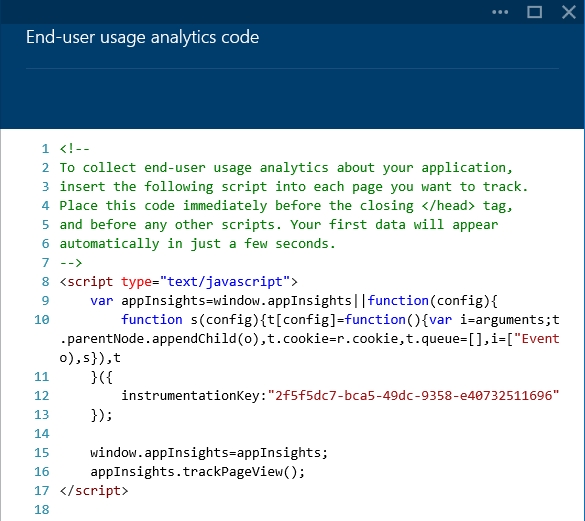
Figure 4: JavaScript tracking code
This section of JavaScript code is what you will need to copy and give to your web developer. The first seven lines of the code are comments, which explain to the developer where to put the code. This code will need to be placed on every page on your site that you wish to track. Most modern web sites are built with content management systems, so you may only need to add this code once to your master page template.
Once the code has been added to your site, you are ready to start reviewing data. Within just a few seconds after the code is installed you should be able to see data in the portal, as long as the web site is being actively used.
Reviewing Usage Data
After you have the code in place to track visitor usage, you are ready to start viewing data. To do so, once again log in to the new Azure management portal athttps://portal.azure.com. As described above, click Browse and then select the site on which you installed the tracking code. This time the Application Insights blade will show some usage data (see Figure 5). As you scroll down inside this blade, you will see some data is now present, but because we have only installed client-side usage tracking, there are other things like webtests, which still won’t show any data.
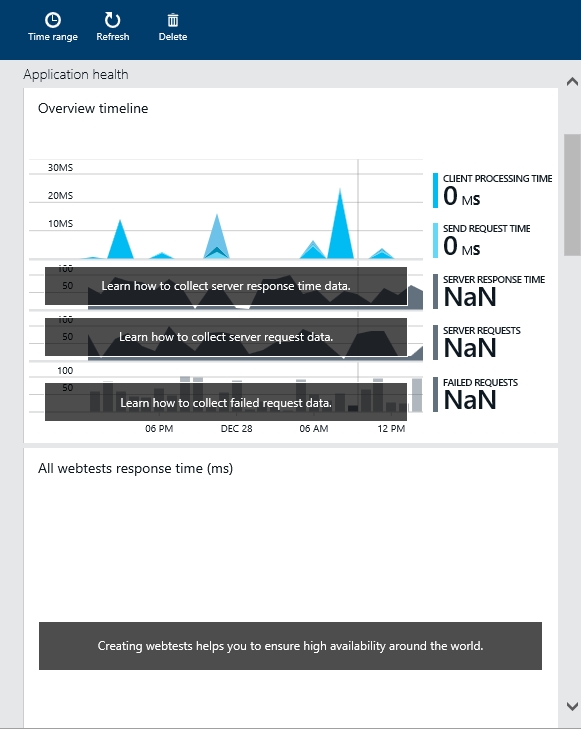
Figure 5: Application Health Data
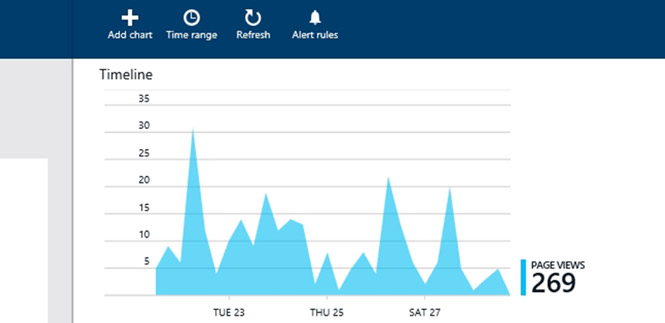
Scroll down in the Application Insights blade until you see a section titled “Usage analytics” as depicted in Figure 6.
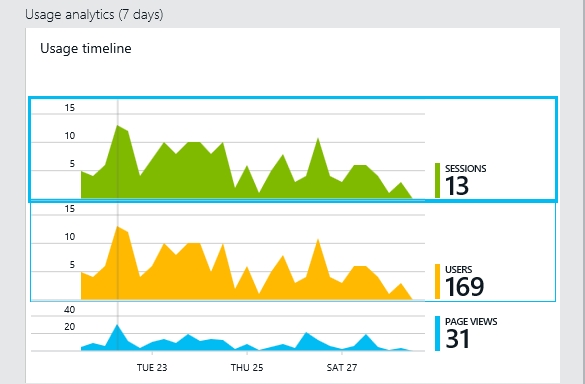
Figure 6: Usage Analytics
To explore any of these three timelines in more detail, simply click on that section and a new blade will appear on the right side. For example, clicking on the bottom, blue timeline will open the “Metrics Explorer” blade and show the page views over the time period. Below the graph will show a table listing of the popular pages for the given time frame. See Figure 7.
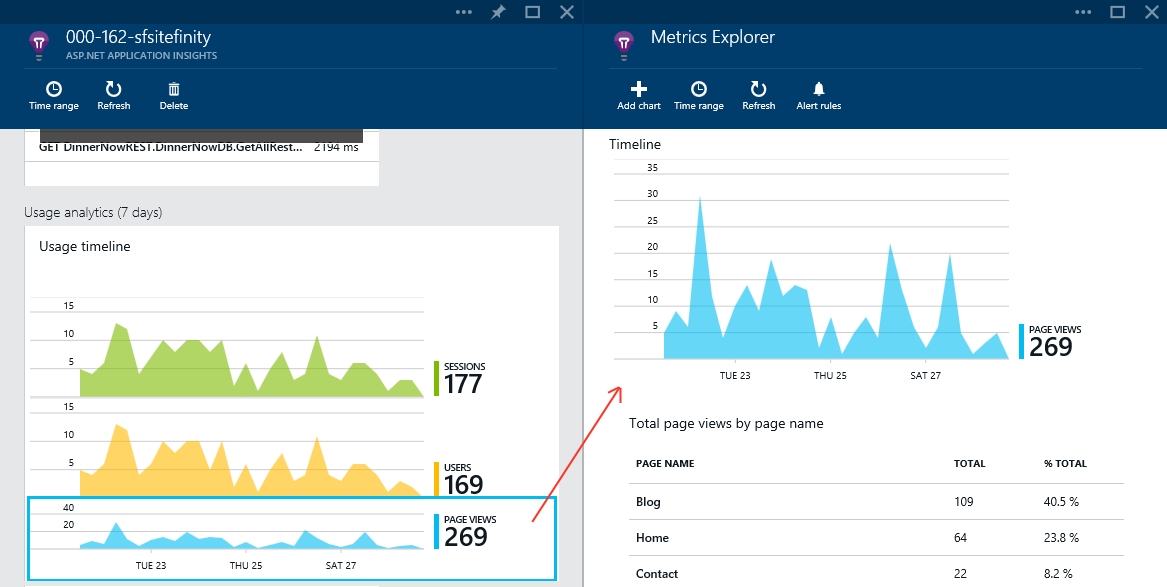
Figure 7: Drilling down into the Metrics Explorer
Note that many items in these blade modules are interactive. For example, clicking on the page name from this page views listing above will allow you to drill down and get more specific data by opening the “Diagnostic search” blade, as shown below.
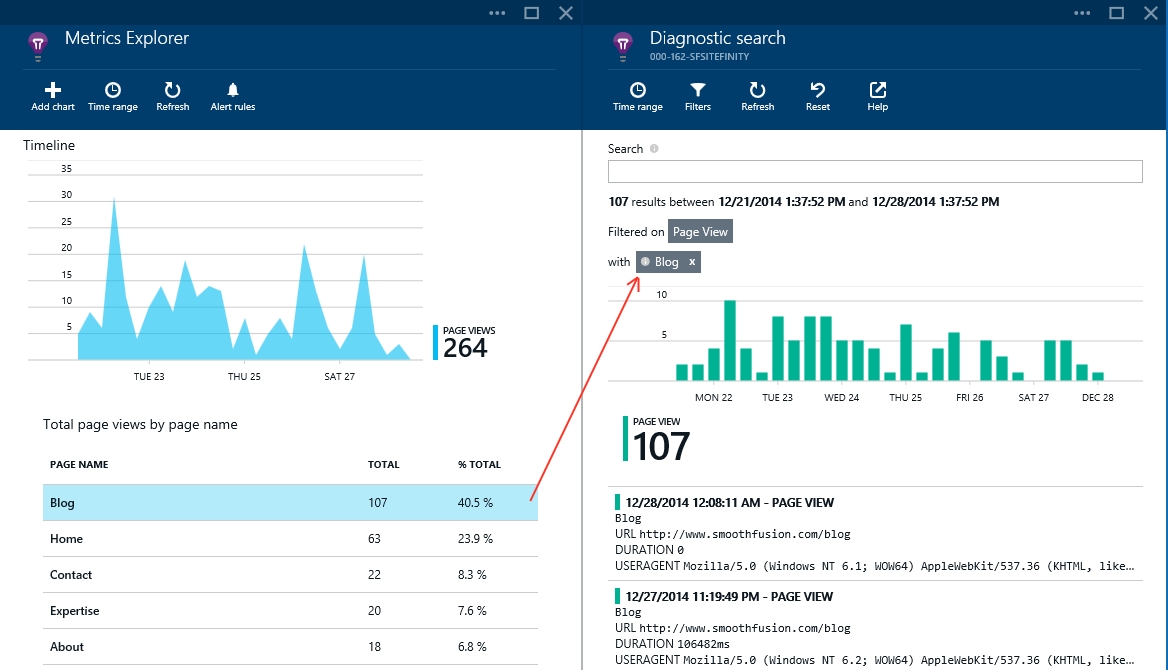
Figure 8: Page view drill down data
Next, you can even drill down from the page view data to get specifics about the user that created the page view.
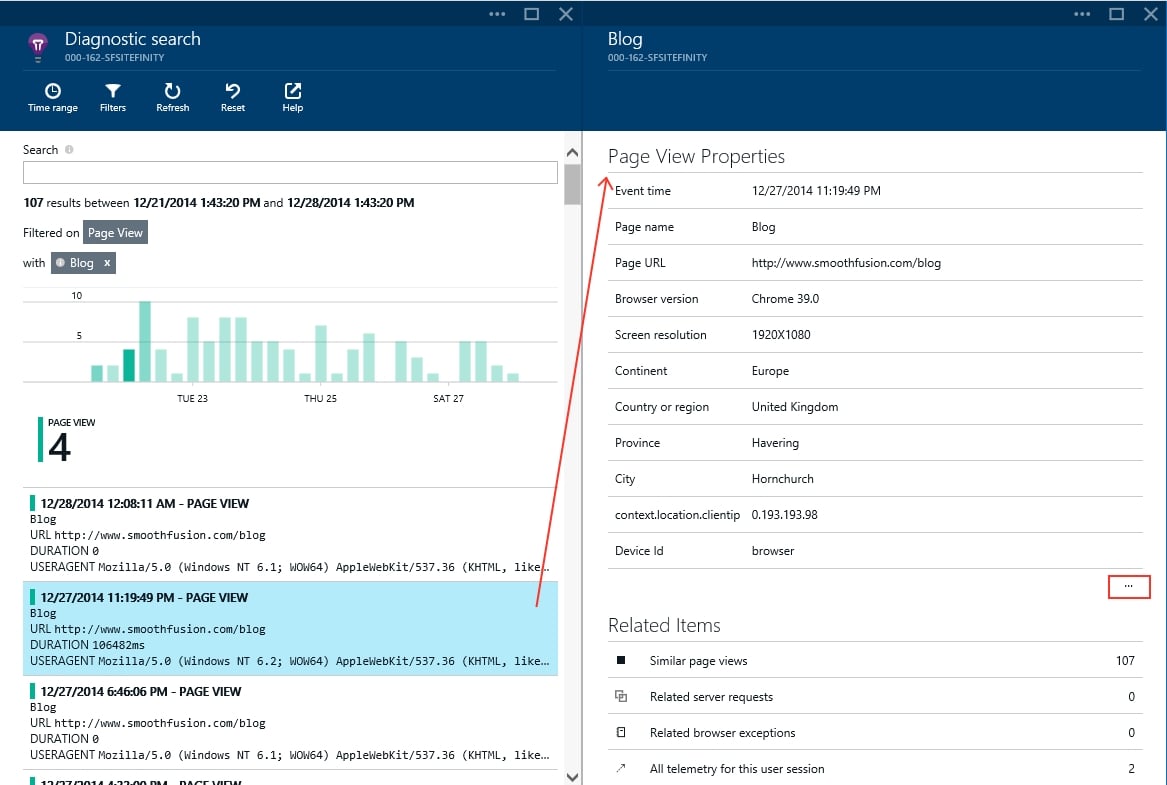
Figure 9: User specific data
Clicking on the ellipsis points outlined on the right gives you even more data about the user’s session.
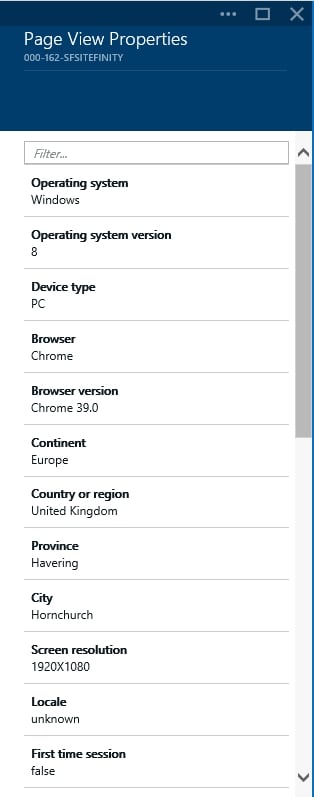
Figure 10: Additional User Data
As you can imagine from the screen shots above, this whole section is very rich with data. You can drill down and get very granular details. Using the Diagnostic search blade, you can also search across data. Using the buttons at the top of the search blade, you can specify the time range or apply filters. In the example in Figure 11, we have applied a filter to show only page views on Android operating systems.
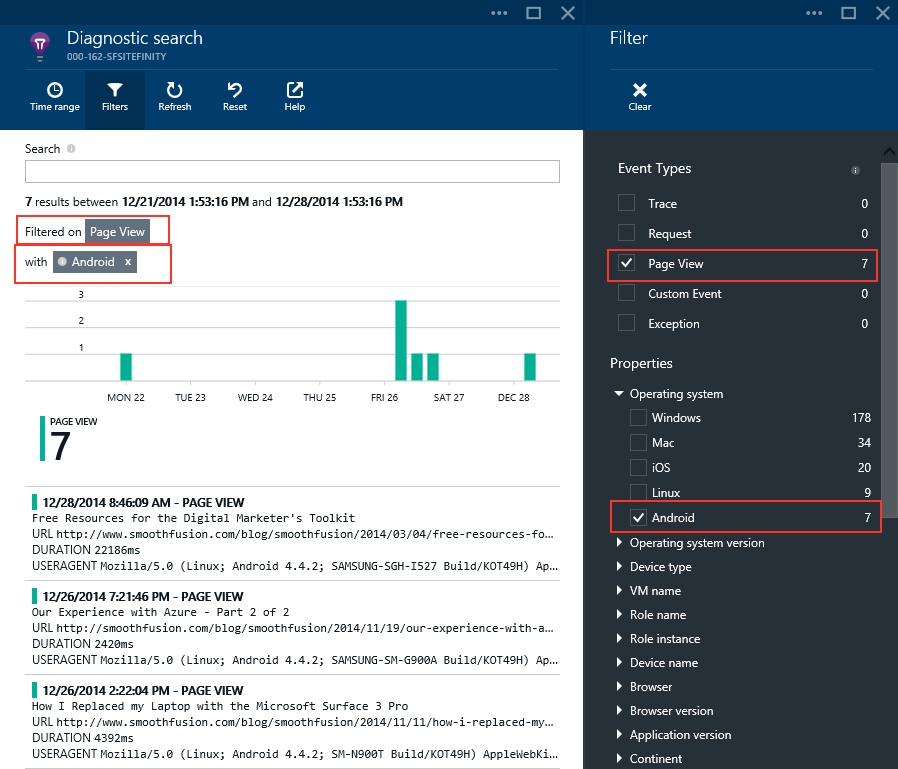
Figure 11: Using Search Filters
Sending Custom Data to Analytics
As described above, it is very simple to add tracking code to your web site that provides very rich analytics data. In some cases you will want to track items that are not automatically tracked out of the box. For example, it is common that you might want to know which outbound links from your site people are clicking. This is not data that is automatically tracked. However, you can use some additional JavaScript on the page to track these outbound links. For example, the “appInsights.trackEvent” method can be used to track these outbound links:
appInsights.trackEvent("ExternalLink", {URL: "http://www.microsoft.com"});
Using this method, a new custom event will be created in your Application Insights dashboard which will show your custom named event “ExternalLink.” See Figure 12.
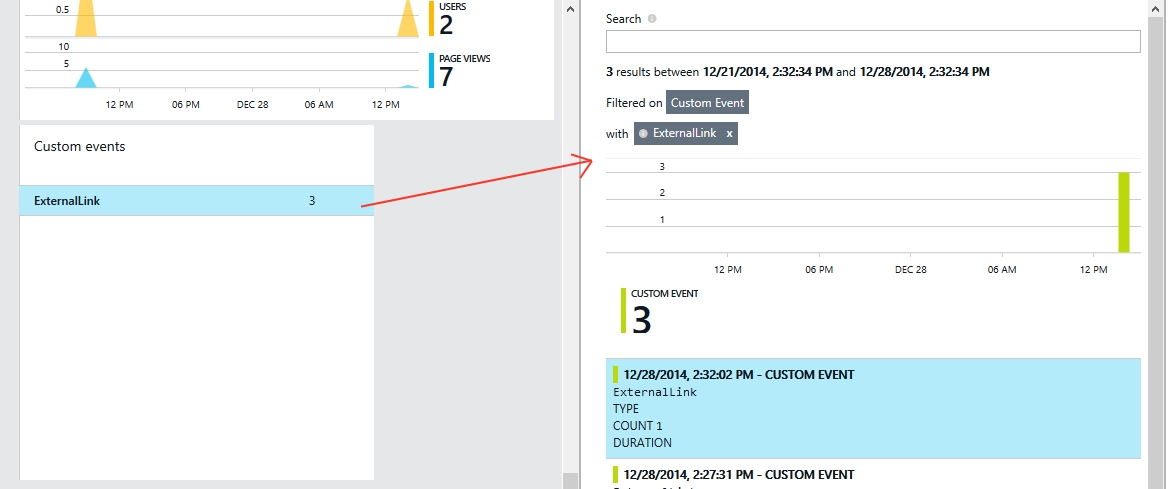
Figure 12: Tracking Custom Events
Note, you will need to get the help of your web developer to implement these types of custom event tracking, but the effort is very minimal.
Additional information about custom event tracking can be found in the Azure documentation on the subject.
Summary
Microsoft’s Azure Application Insights is a suite of tools and services that provides rich application data. In this article, we focused on one small part of this tool set—usage analytics. By adding a simple snippet of JavaScript to your web site page template, you get rich analytics and a nice interface in which to explore the data. With some additional JavaScript coding, you can also record custom data allowing you to extend the out-of-the-box features. In future posts, we will explore more of the tools available in Application Insights.
Smooth Fusion is a custom web and mobile development company and leading Progress Sitefinity CMS Partner. We create functional, usable, secure, and elegant software while striving to make the process painless for our customers. We offer a set of core services that we’ve adapted and refined for more than 250 clients over our 18 years in business. We’ve completed more than 1800 projects across dozens of industries. To talk to us about your project or review our portfolio, send us a message and one of our project managers will reach out to you quickly.